[Data Analysis] SQL Recipe for Data Analysis Tutorial #6 - Aggregating data based on the time series
Goal
- Studying SQL for data analysis
- Practicing chapter 4th in the book
- Studying SQL for Manipulating data
Practice
Book for studying
| Title | 데이터 분석을 위한 SQL 레시피 |
|---|---|
| Author | Nagato Kasaki, Naoto Tamiya |
| Translator | 윤인성 |
| Publisher | 한빛미디어 |
| Chapter | 4 |
| Lesson | 9 |
- I’m gonna study basic SQL syntax and functions for data analysis
- I’m gonna study how to extract data for sales
- I’m gonna study how to aggregate data based on the time series
- I’m gonna try to load test data on PostgreSQL and execute queries in the book
4.9. Aggregating data based on the time series
4.9.1. Aggregate sales amount by date
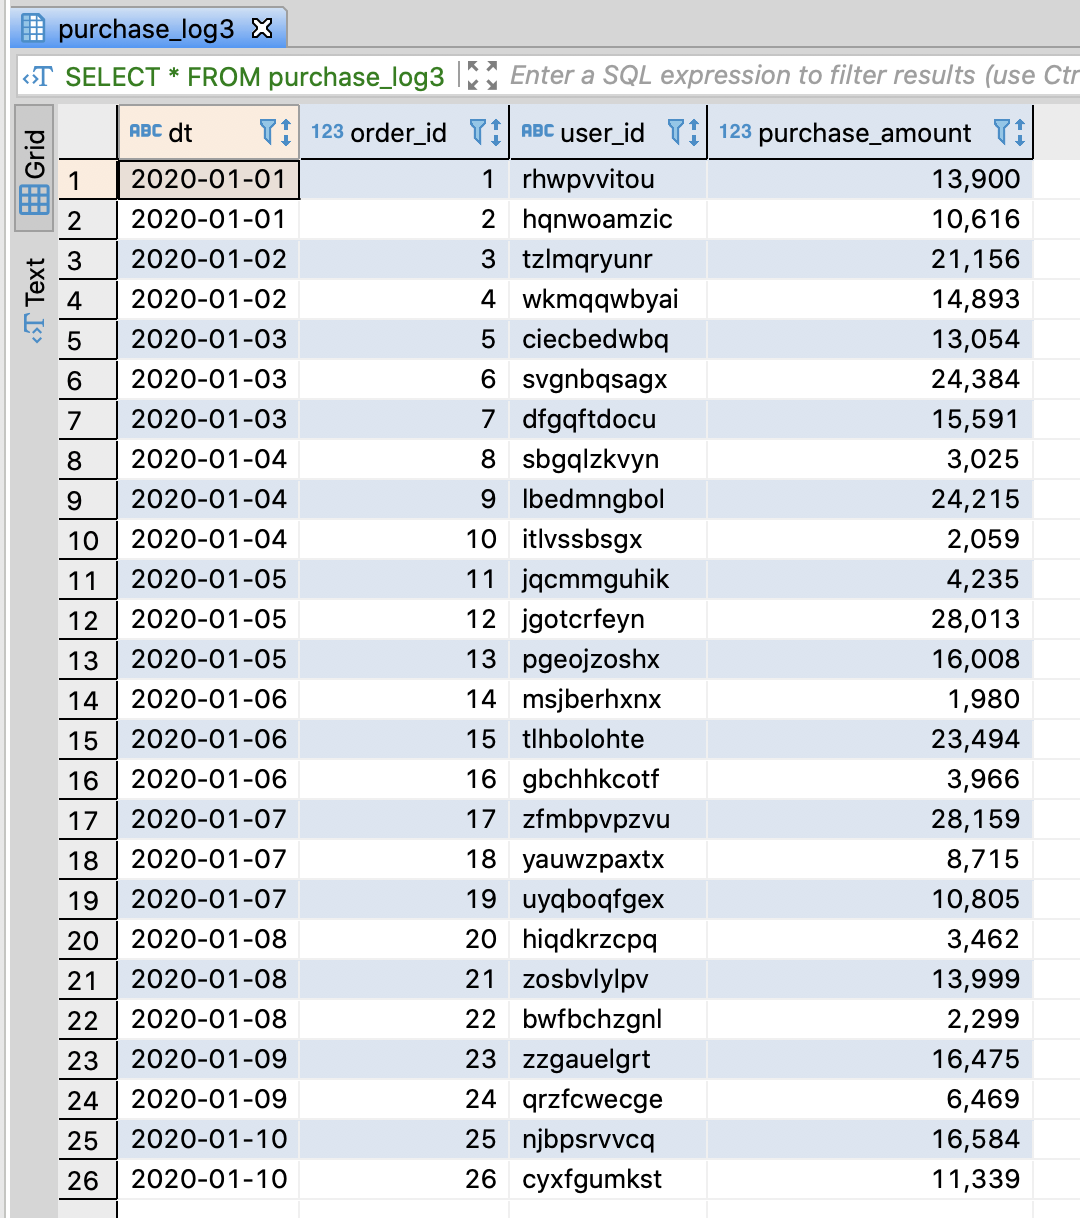
Create purchase log table
-- DROP TABLE IF EXISTS purchase_log;
-- Create purchase log table
CREATE TABLE purchase_log3 (
    dt              varchar(255)
  , order_id        integer
  , user_id         varchar(255)
  , purchase_amount integer
);

-- Insert sample data
INSERT INTO purchase_log3
VALUES
    ('2020-01-01',  1, 'rhwpvvitou', 13900)
  , ('2020-01-01',  2, 'hqnwoamzic', 10616)
  , ('2020-01-02',  3, 'tzlmqryunr', 21156)
  , ('2020-01-02',  4, 'wkmqqwbyai', 14893)
  , ('2020-01-03',  5, 'ciecbedwbq', 13054)
  , ('2020-01-03',  6, 'svgnbqsagx', 24384)
  , ('2020-01-03',  7, 'dfgqftdocu', 15591)
  , ('2020-01-04',  8, 'sbgqlzkvyn',  3025)
  , ('2020-01-04',  9, 'lbedmngbol', 24215)
  , ('2020-01-04', 10, 'itlvssbsgx',  2059)
  , ('2020-01-05', 11, 'jqcmmguhik',  4235)
  , ('2020-01-05', 12, 'jgotcrfeyn', 28013)
  , ('2020-01-05', 13, 'pgeojzoshx', 16008)
  , ('2020-01-06', 14, 'msjberhxnx',  1980)
  , ('2020-01-06', 15, 'tlhbolohte', 23494)
  , ('2020-01-06', 16, 'gbchhkcotf',  3966)
  , ('2020-01-07', 17, 'zfmbpvpzvu', 28159)
  , ('2020-01-07', 18, 'yauwzpaxtx',  8715)
  , ('2020-01-07', 19, 'uyqboqfgex', 10805)
  , ('2020-01-08', 20, 'hiqdkrzcpq',  3462)
  , ('2020-01-08', 21, 'zosbvlylpv', 13999)
  , ('2020-01-08', 22, 'bwfbchzgnl',  2299)
  , ('2020-01-09', 23, 'zzgauelgrt', 16475)
  , ('2020-01-09', 24, 'qrzfcwecge',  6469)
  , ('2020-01-10', 25, 'njbpsrvvcq', 16584)
  , ('2020-01-10', 26, 'cyxfgumkst', 11339)
;

commit;

-- Select sample data
SELECT * FROM purchase_log3;
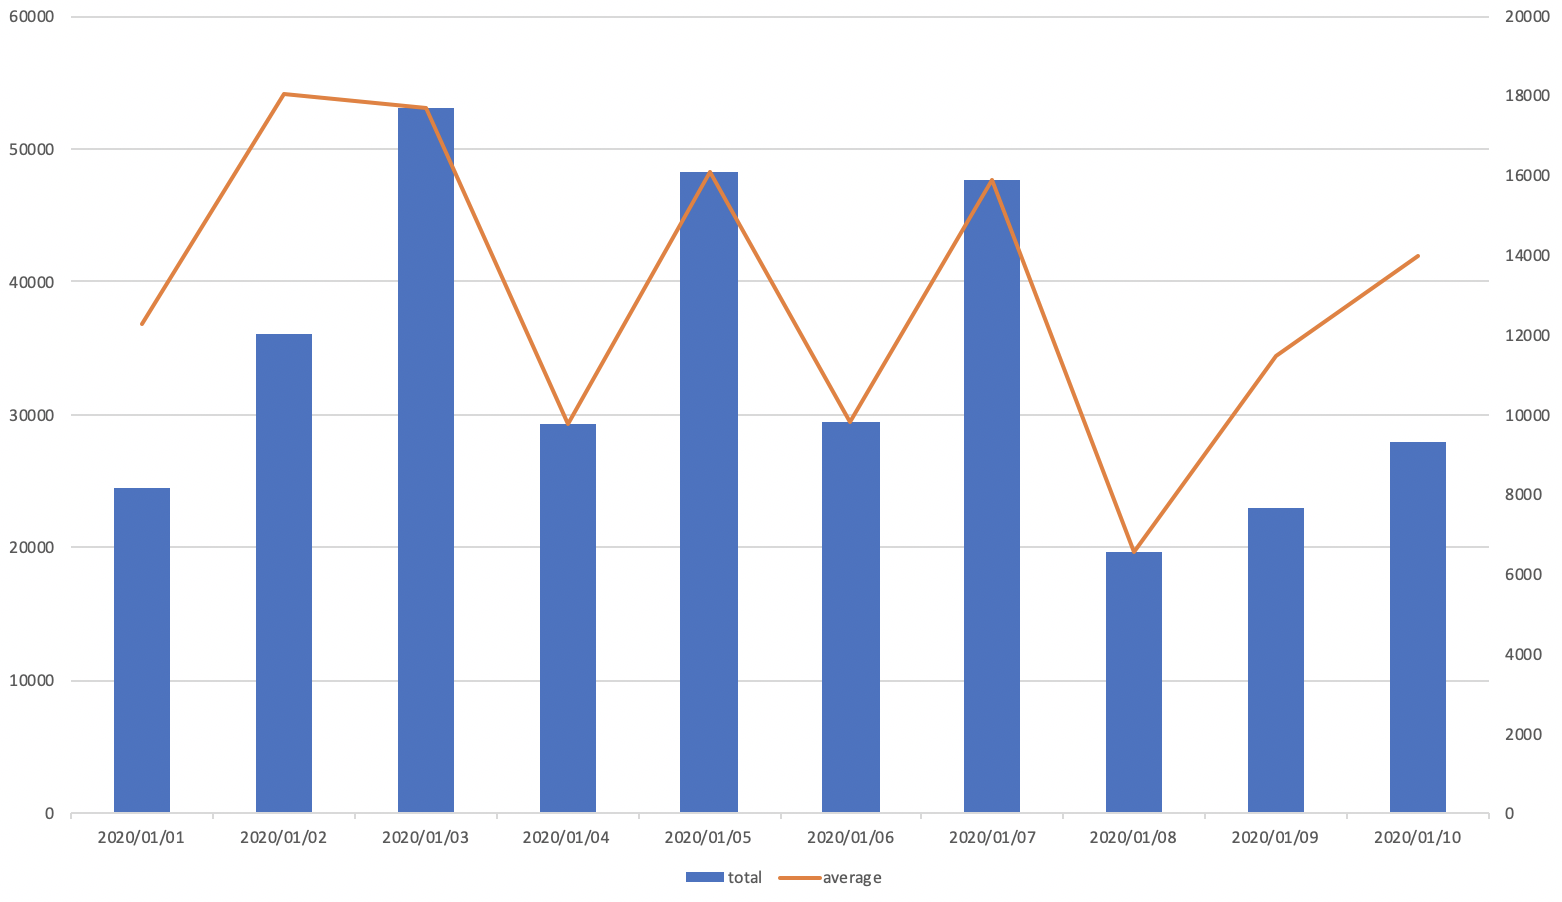
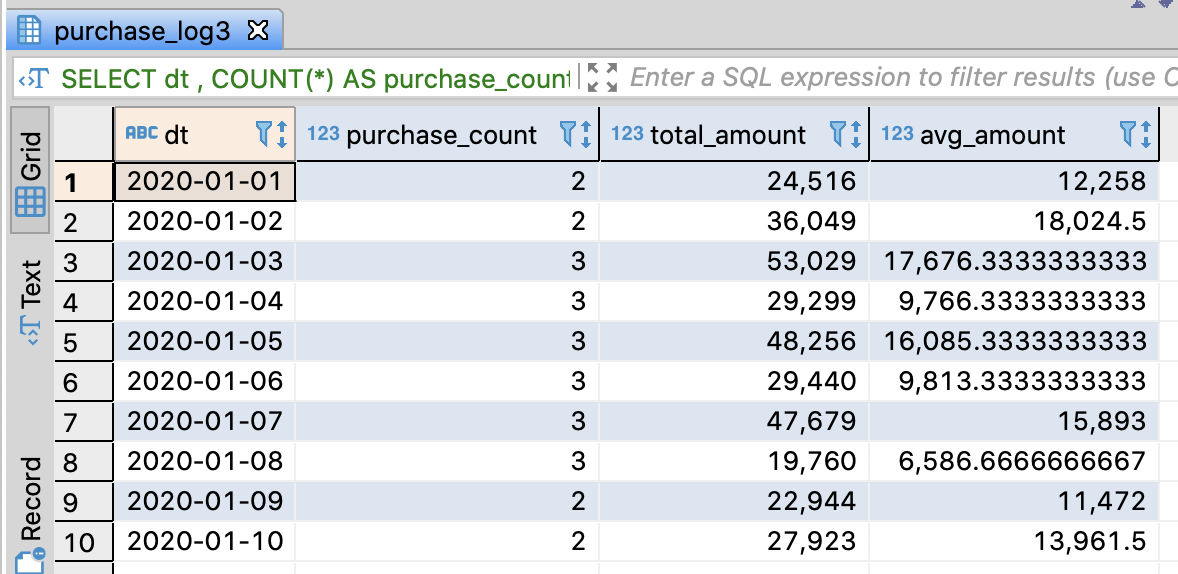
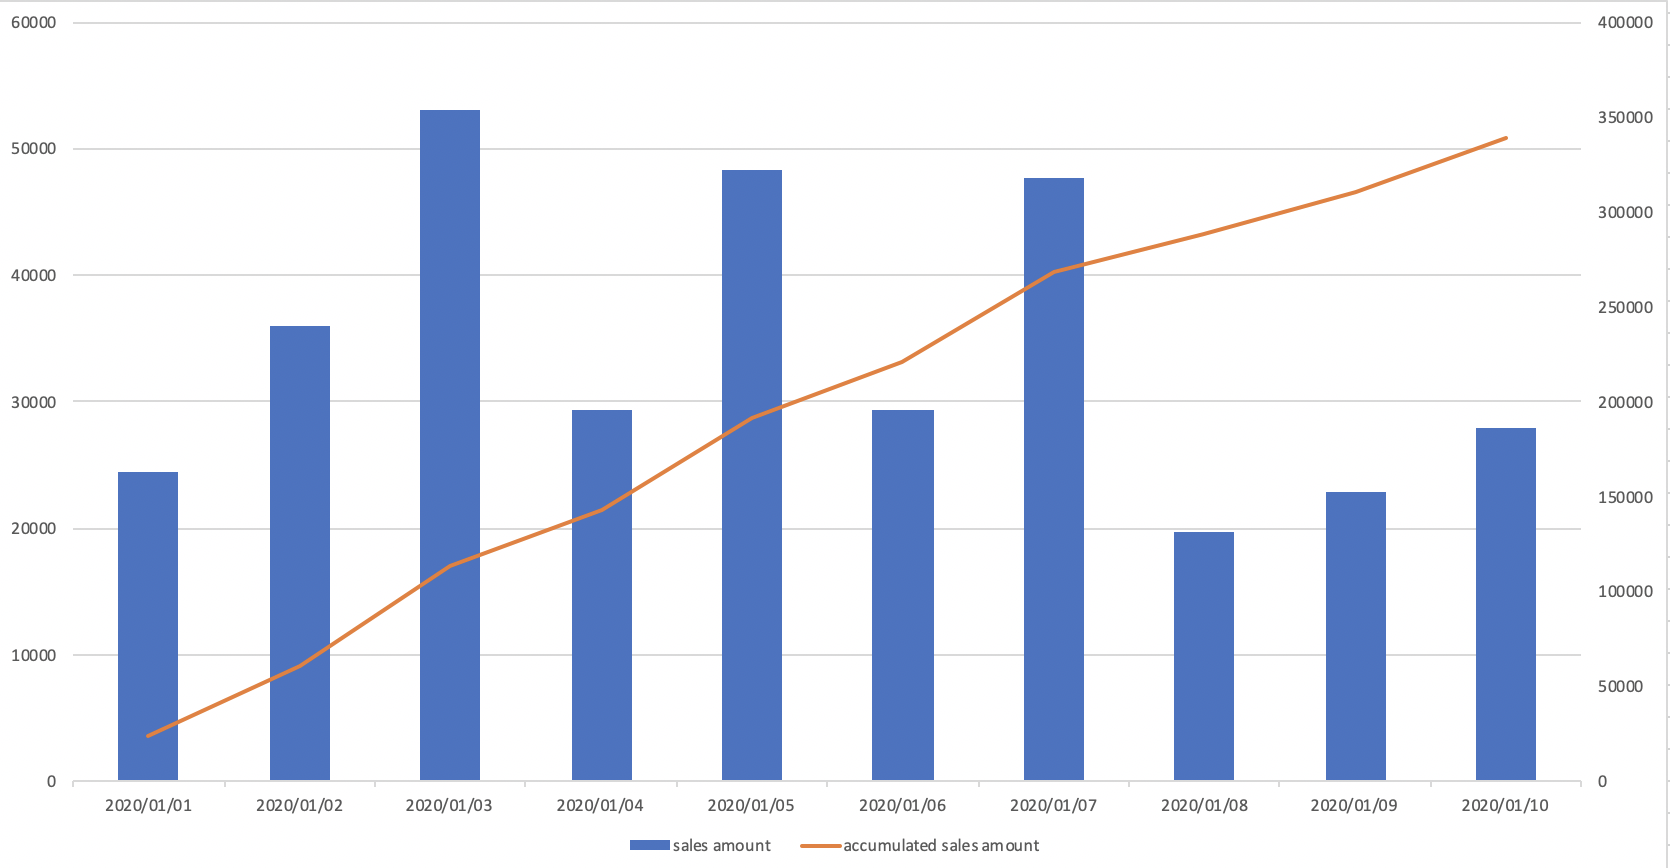
Aggregate sales amount and the average purchase amount per day
- Imagine that you have to make the below chart
-- Aggregate sales amount and the average purchase amount per day
SELECT dt
     , COUNT(*) AS purchase_count
     , SUM(purchase_amount) AS total_amount
     , AVG(purchase_amount) AS avg_amount
  FROM purchase_log3
 GROUP BY dt
 ORDER BY dt ASC
;
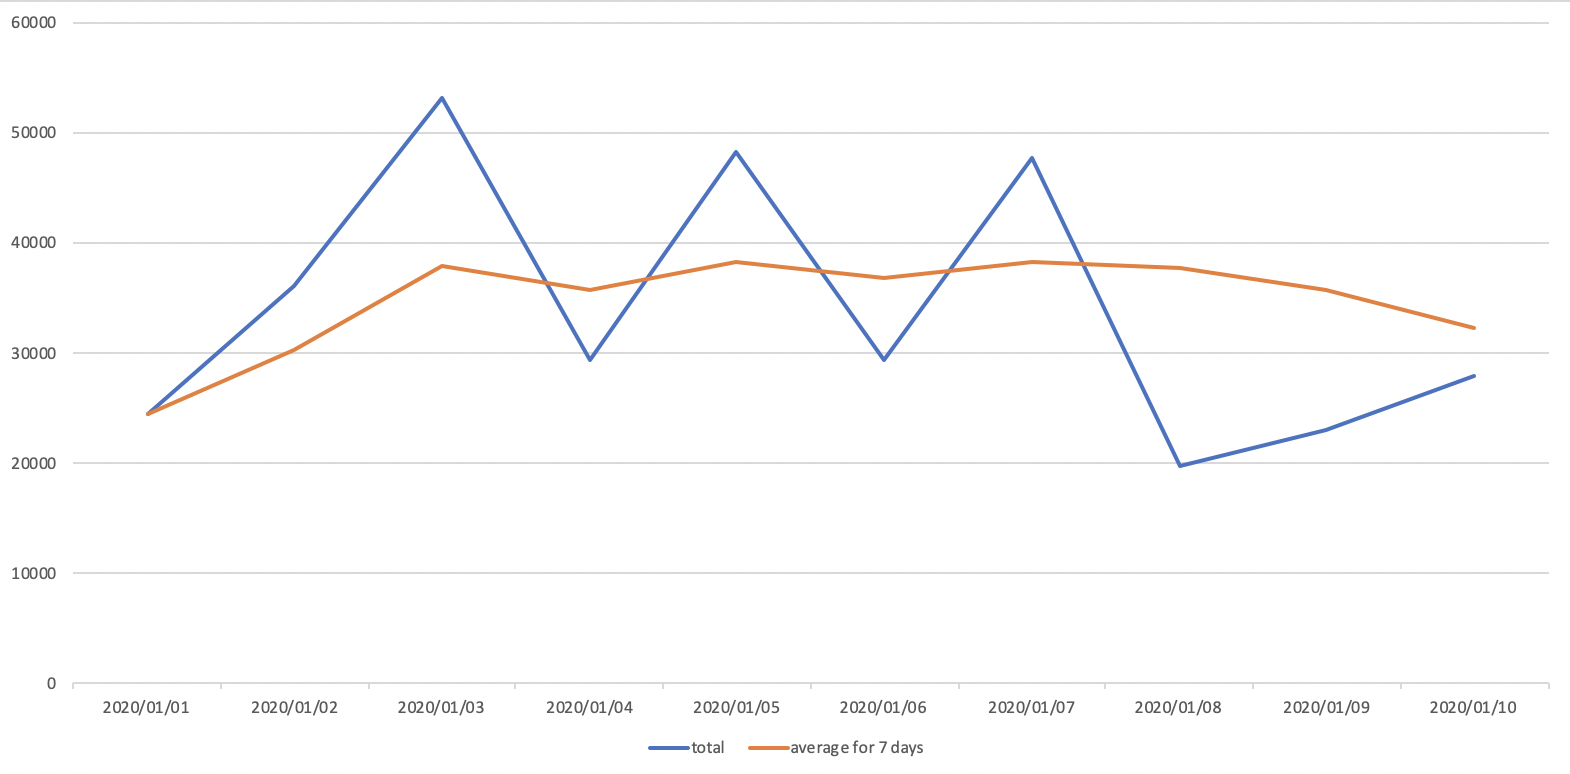
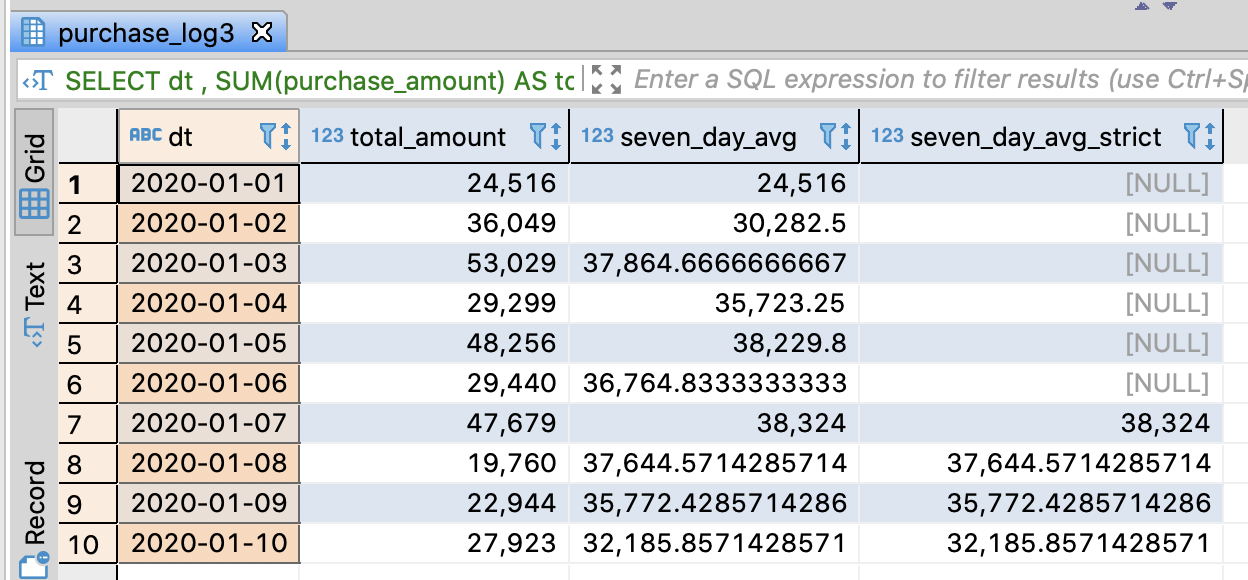
4.9.2. Extract the change followed by date through a moving average
- You can easily recognize the increase and decrease chage through the moving average
- Imagine that you have to make the below chart
-- Extract the change followed by date through a moving average
SELECT dt
     , SUM(purchase_amount) AS total_amount
     -- Caculate the recent average amount for 7 days
     -- Get the average amount even if there are less 7 days
     , AVG(SUM(purchase_amount))
         OVER(ORDER BY dt ROWS BETWEEN 6 PRECEDING AND CURRENT ROW)
         AS seven_day_avg
     -- Calculate the recent average amount for 7 days exactly
     -- Ignore the average amount which has less 7 days
     , CASE WHEN 7 = COUNT(*)
                      OVER(ORDER BY dt ROWS BETWEEN 6 PRECEDING AND CURRENT ROW)
              THEN AVG(SUM(purchase_amount))
                    OVER(ORDER BY dt ROWS BETWEEN 6 PRECEDING AND CURRENT ROW)
            END AS seven_day_avg_strict
  FROM purchase_log3
 GROUP BY dt
 ORDER BY dt ASC
;
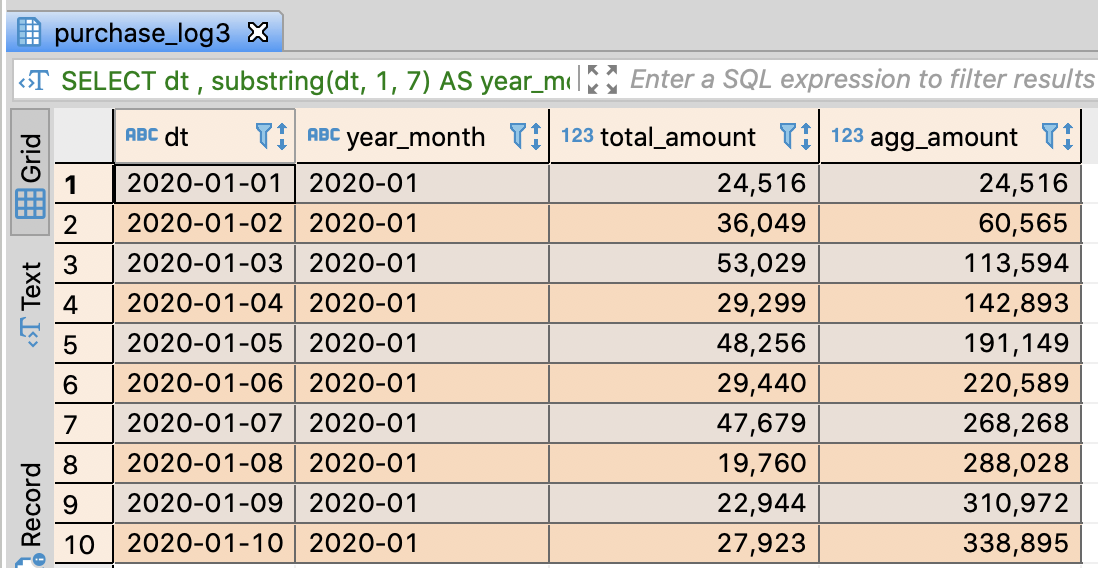
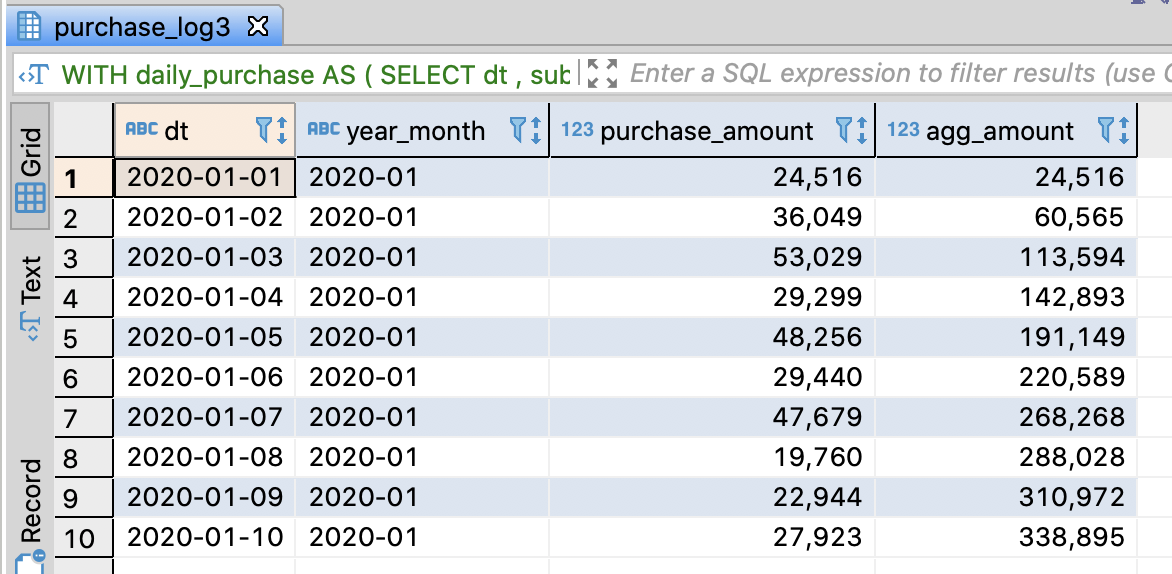
4.9.3. Calculate the accumulated sales amount of this month
- Imagine that you have to make the below chart
-- Calculate the accumulated sales amount of this month
SELECT dt
     -- Extract year-month
     -- if PostgreSQL, Hive, SparkSQL, Redshift
     , substring(dt, 1, 7) AS year_month
     -- if PostgreSQL, Hive, SparkSQL, BigQuery
     -- , substr(dt, 1, 7) AS year_month
     , SUM(purchase_amount) AS total_amount
     , SUM(SUM(purchase_amount))
         OVER(PARTITION BY substring(dt, 1, 7)
              ORDER BY dt
              ROWS UNBOUNDED PRECEDING)
         AS agg_amount
  FROM purchase_log3
 GROUP BY dt
 ORDER BY dt
;
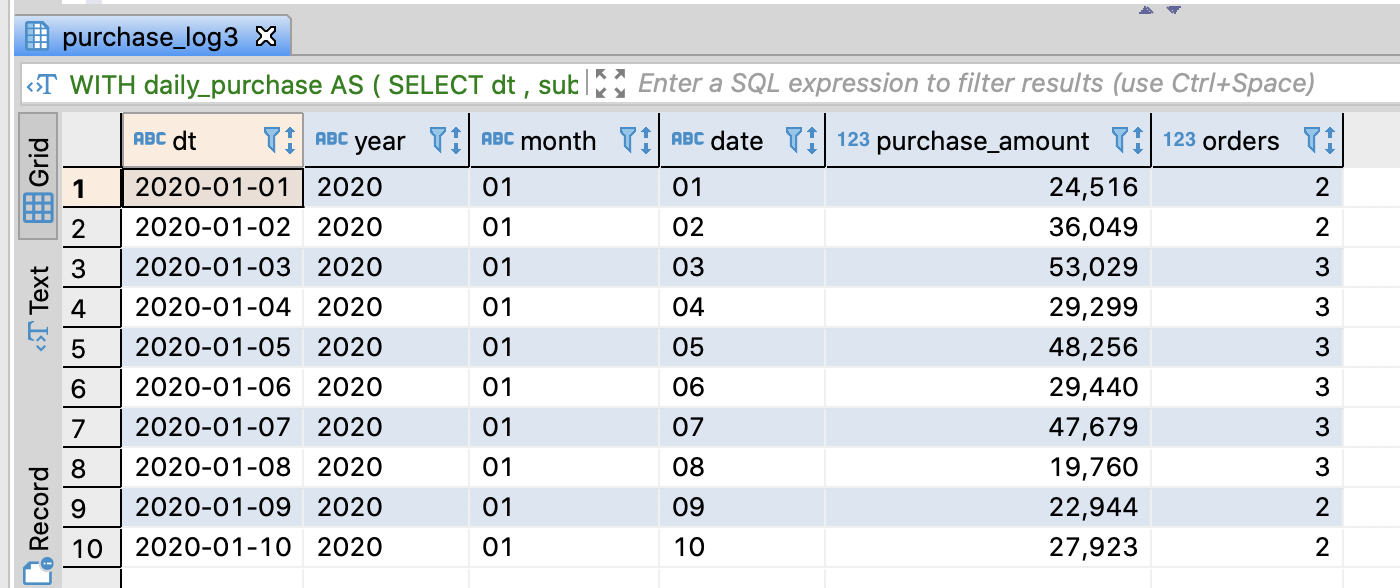
Enhance the readability of query through WITH clause
- substring functions were used repeatly and it ruined the code readablity
- You can make it better by WITH
In BigData analysis, it is usually more important to make the query distinctly than the performance
-- Make a temporary view indicating daily sales amount
WITH
daily_purchase AS (
  SELECT dt
       -- Extract year, month, date respectively
       -- if PostgreSQL, Hive, SparkSQL, Redshift, use substring
       -- if BigQuery, use substr
       , substring(dt, 1, 4) AS year
       , substring(dt, 6, 2) AS month
       , substring(dt, 9, 2) AS date
       , SUM(purchase_amount) AS purchase_amount
       , COUNT(order_id) AS orders
    FROM purchase_log3
   GROUP BY dt
)
SELECT *
  FROM daily_purchase
 ORDER BY dt
;
-- Calculate the accumulated sales amount of this month through WITH
WITH
daily_purchase AS (
  SELECT dt
       -- Extract year, month, date respectively
       -- if PostgreSQL, Hive, SparkSQL, Redshift, use substring
       -- if BigQuery, use substr
       , substring(dt, 1, 4) AS year
       , substring(dt, 6, 2) AS month
       , substring(dt, 9, 2) AS date
       , SUM(purchase_amount) AS purchase_amount
       , COUNT(order_id) AS orders
    FROM purchase_log3
   GROUP BY dt
)
SELECT dt
     , concat(year, '-', month) AS year_month
     -- if Redshift, concat or ||
     -- year || '-' || month AS year_month
     , purchase_amount
     , SUM(purchase_amount)
         OVER(PARTITION BY year, month ORDER BY dt ROWS UNBOUNDED PRECEDING)
         AS agg_amount
  FROM daily_purchase
 ORDER BY dt
;
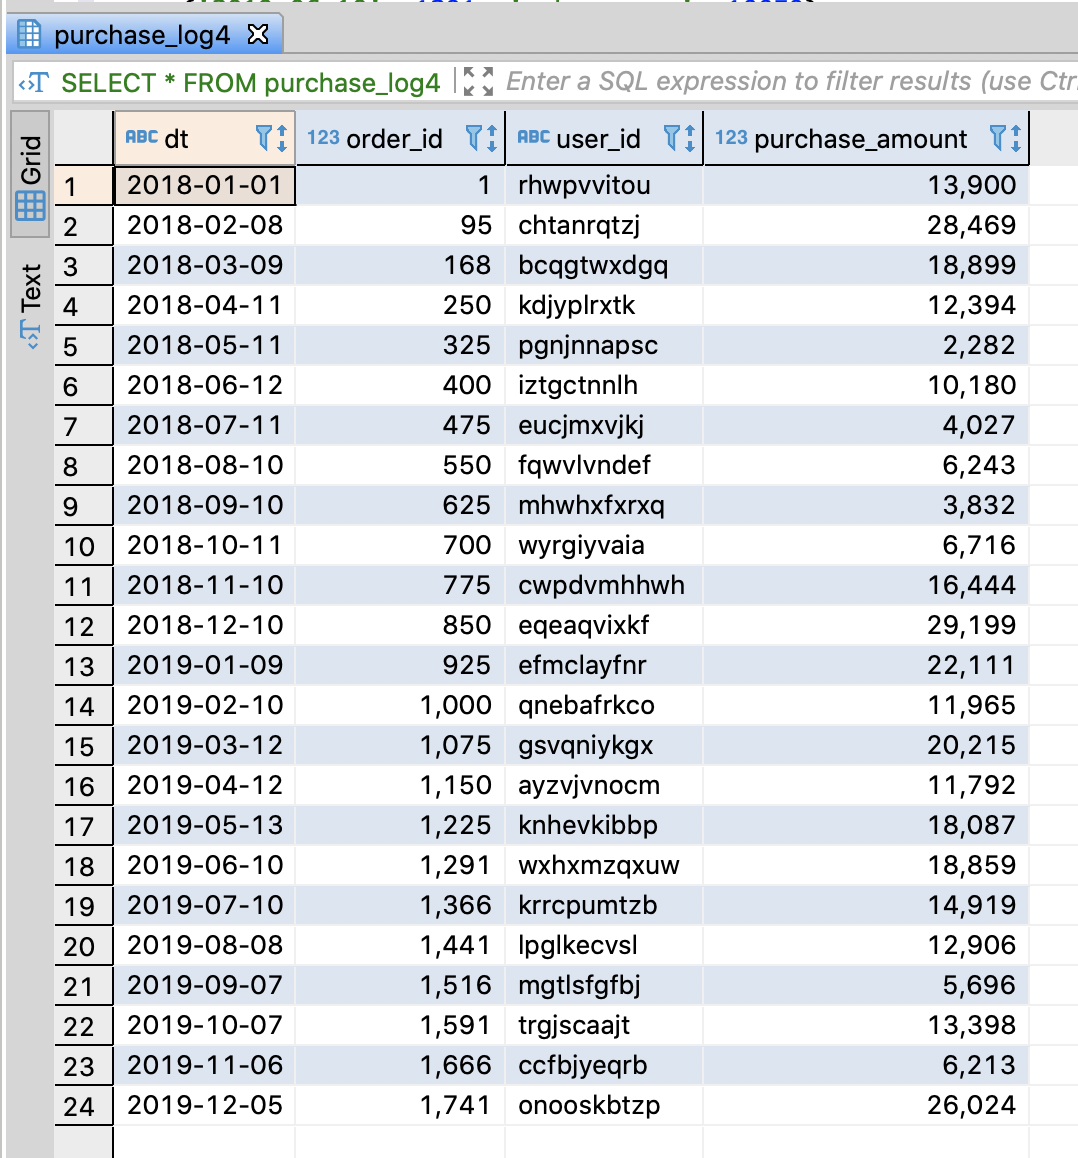
4.9.4. Calculate the sales per month and compare to the one of last year
Create purchase log table
- Insert sample data which contains sale amount from 2018 to 2019
-- DROP TABLE IF EXISTS purchase_log4;
CREATE TABLE purchase_log4 (
    dt              varchar(255)
  , order_id        integer
  , user_id         varchar(255)
  , purchase_amount integer
);

-- Insert sample data
INSERT INTO purchase_log4
VALUES
    ('2018-01-01',    1, 'rhwpvvitou', 13900)
  , ('2018-02-08',   95, 'chtanrqtzj', 28469)
  , ('2018-03-09',  168, 'bcqgtwxdgq', 18899)
  , ('2018-04-11',  250, 'kdjyplrxtk', 12394)
  , ('2018-05-11',  325, 'pgnjnnapsc',  2282)
  , ('2018-06-12',  400, 'iztgctnnlh', 10180)
  , ('2018-07-11',  475, 'eucjmxvjkj',  4027)
  , ('2018-08-10',  550, 'fqwvlvndef',  6243)
  , ('2018-09-10',  625, 'mhwhxfxrxq',  3832)
  , ('2018-10-11',  700, 'wyrgiyvaia',  6716)
  , ('2018-11-10',  775, 'cwpdvmhhwh', 16444)
  , ('2018-12-10',  850, 'eqeaqvixkf', 29199)
  , ('2019-01-09',  925, 'efmclayfnr', 22111)
  , ('2019-02-10', 1000, 'qnebafrkco', 11965)
  , ('2019-03-12', 1075, 'gsvqniykgx', 20215)
  , ('2019-04-12', 1150, 'ayzvjvnocm', 11792)
  , ('2019-05-13', 1225, 'knhevkibbp', 18087)
  , ('2019-06-10', 1291, 'wxhxmzqxuw', 18859)
  , ('2019-07-10', 1366, 'krrcpumtzb', 14919)
  , ('2019-08-08', 1441, 'lpglkecvsl', 12906)
  , ('2019-09-07', 1516, 'mgtlsfgfbj',  5696)
  , ('2019-10-07', 1591, 'trgjscaajt', 13398)
  , ('2019-11-06', 1666, 'ccfbjyeqrb',  6213)
  , ('2019-12-05', 1741, 'onooskbtzp', 26024)
;

commit;

-- Select sample data
SELECT * FROM purchase_log4;
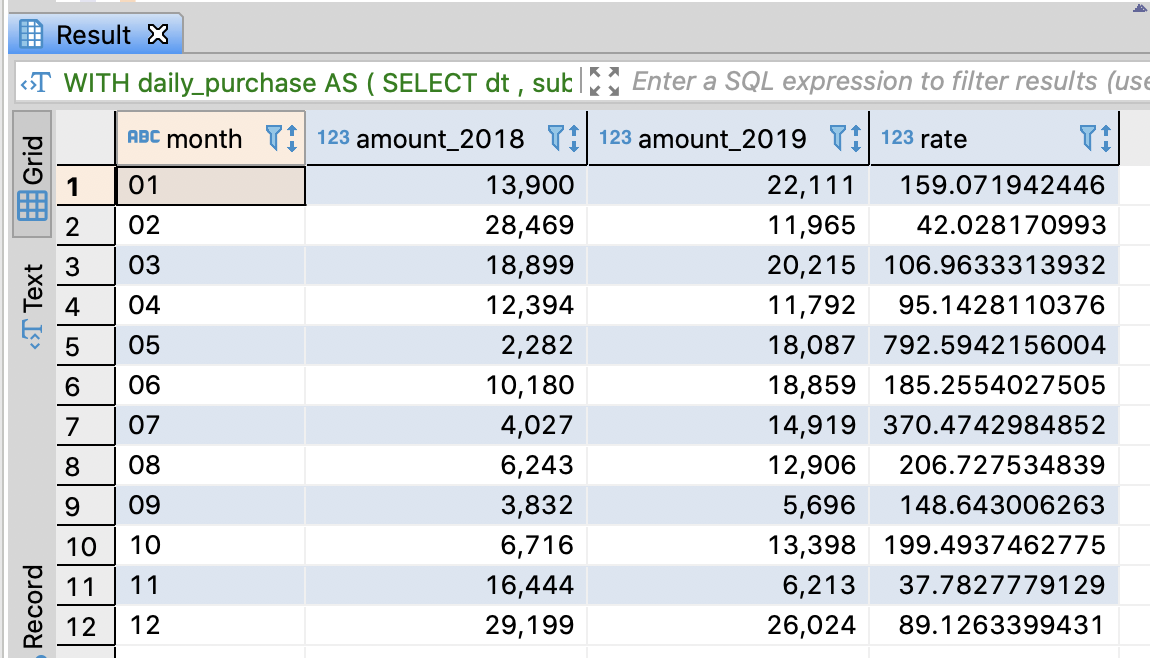
Calculate the sales per month and compare to the one of last year
- Imagine that you have to make the below chart
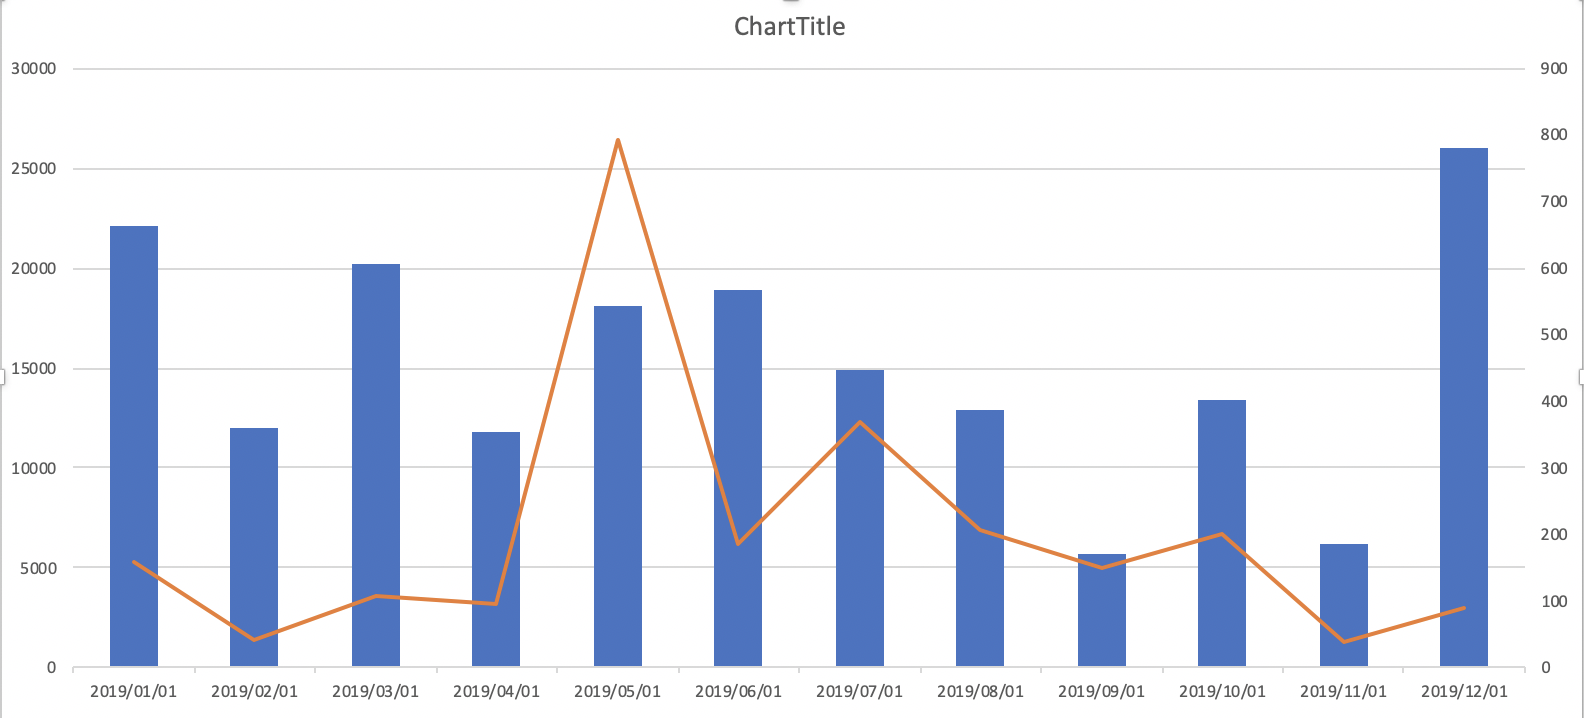
-- Calculate the sales per month and compare to the one of last year
WITH
daily_purchase AS (
  SELECT dt
       -- Extract year, month, date respectively
       -- if PostgreSQL, Hive, SparkSQL, Redshift, use substring
       -- if BigQuery, use substr
       , substring(dt, 1, 4) AS year
       , substring(dt, 6, 2) AS month
       , substring(dt, 9, 2) AS date
       , SUM(purchase_amount) AS purchase_amount
       , COUNT(order_id) AS orders
    FROM purchase_log4
   GROUP BY dt
)
SELECT month
     , SUM(CASE year WHEN '2018' THEN purchase_amount END) AS amount_2018
     , SUM(CASE year WHEN '2019' THEN purchase_amount END) AS amount_2019
     , 100.0 * SUM(CASE year WHEN '2019' THEN purchase_amount END)
       / SUM(CASE year WHEN '2018' THEN purchase_amount END)
         AS rate
  FROM daily_purchase
 GROUP BY month
 ORDER BY month
;
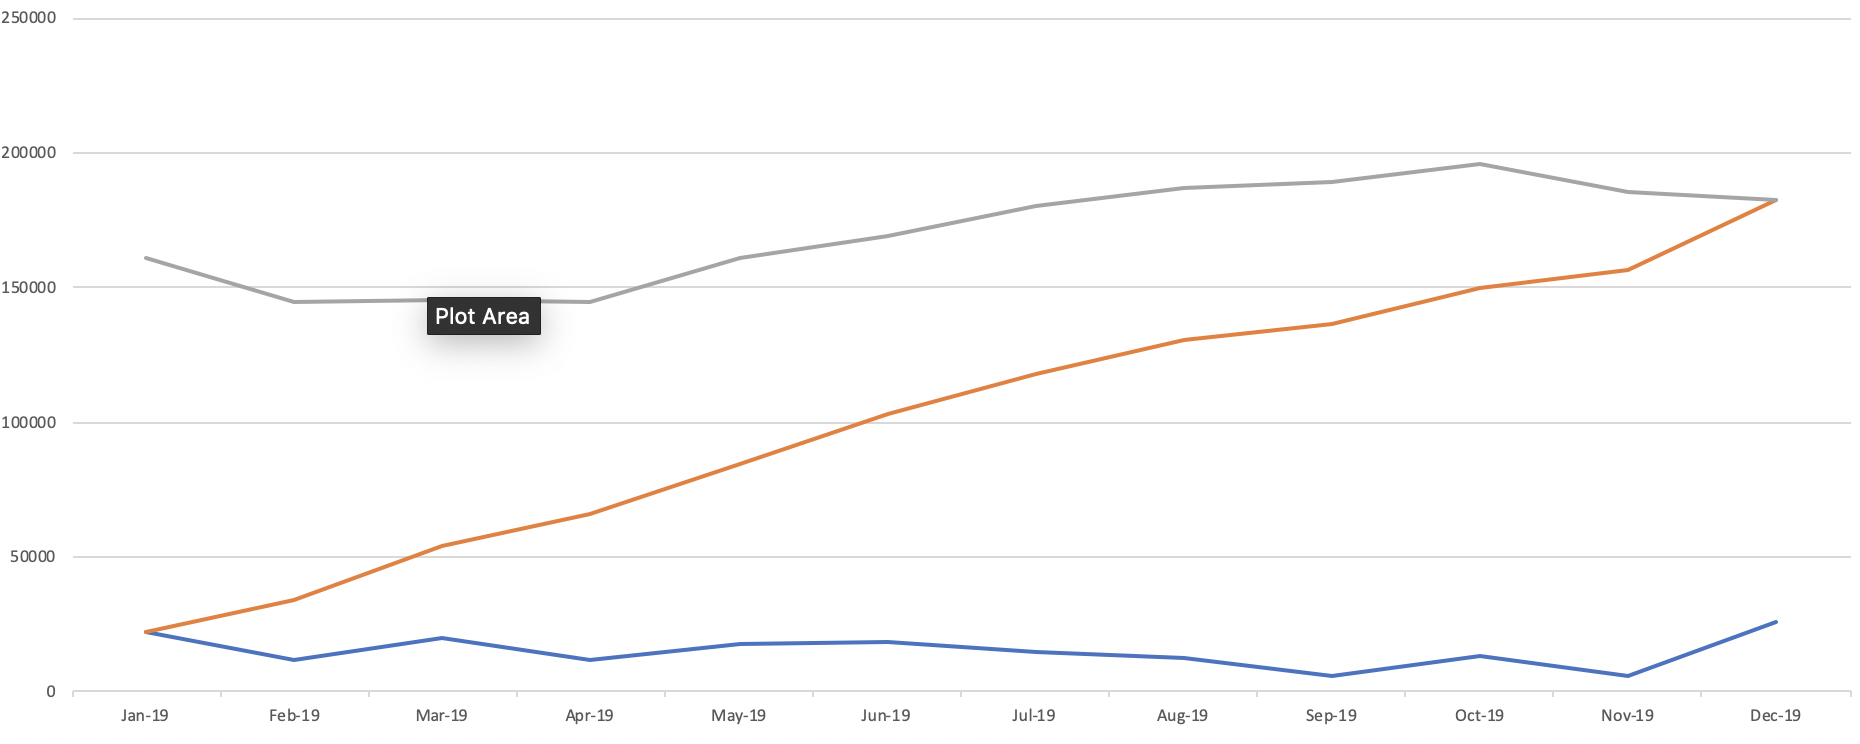
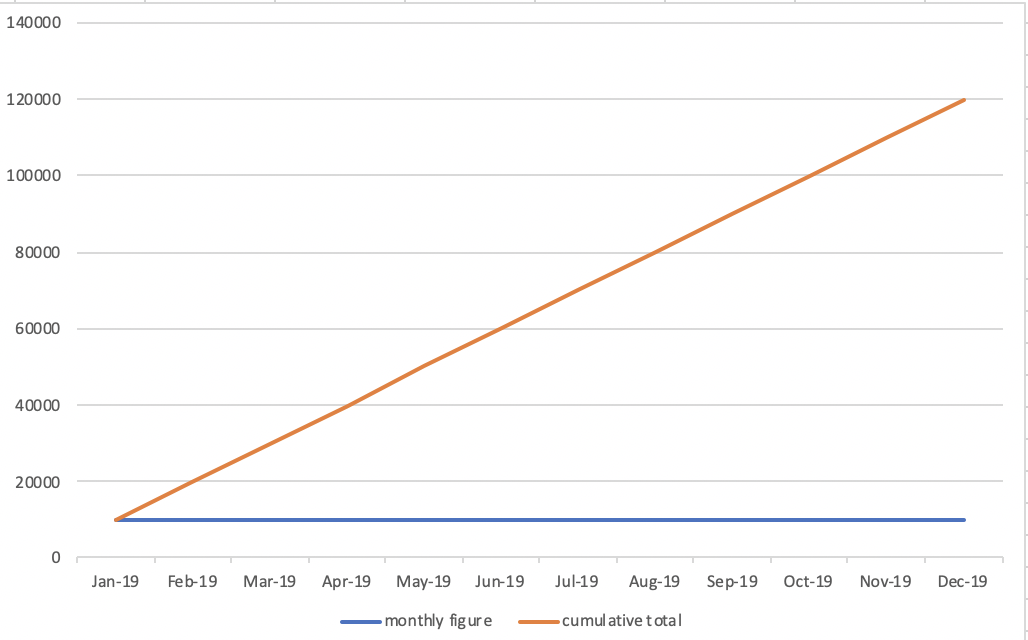
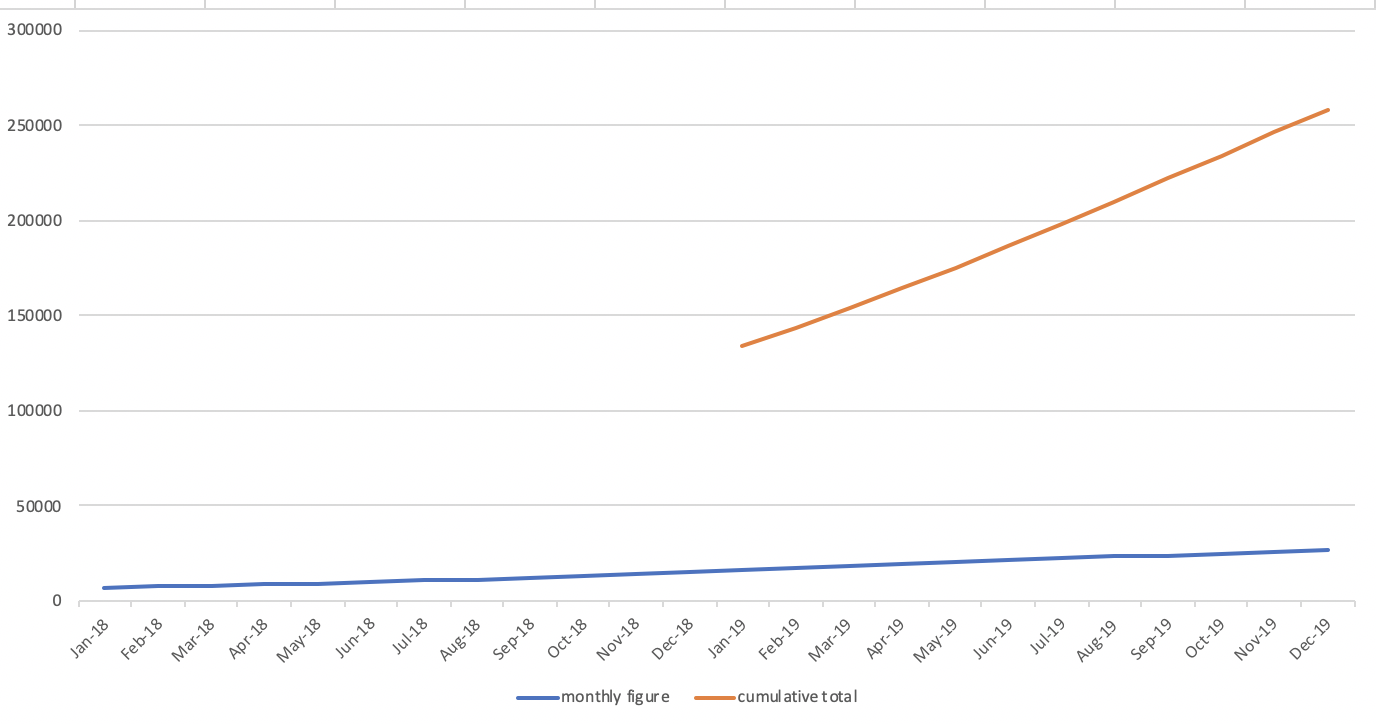
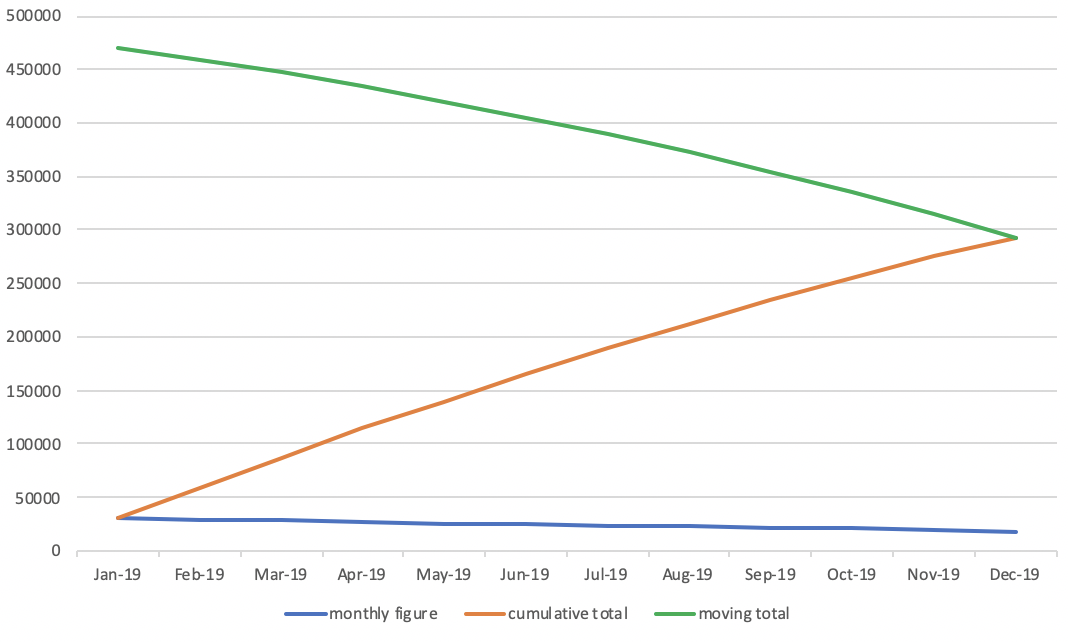
4.9.5. Utilize Z chart
- Z chart
- A diagram charting values over a period (frequently one year) and showing simultaneously monthly figures (or weekly or daily), cumulative totals and the moving averages.
- It normally takes a Z shape, hence its title and is of use in clarifying the trends present in the data displayed
What factors are needed for Z chart
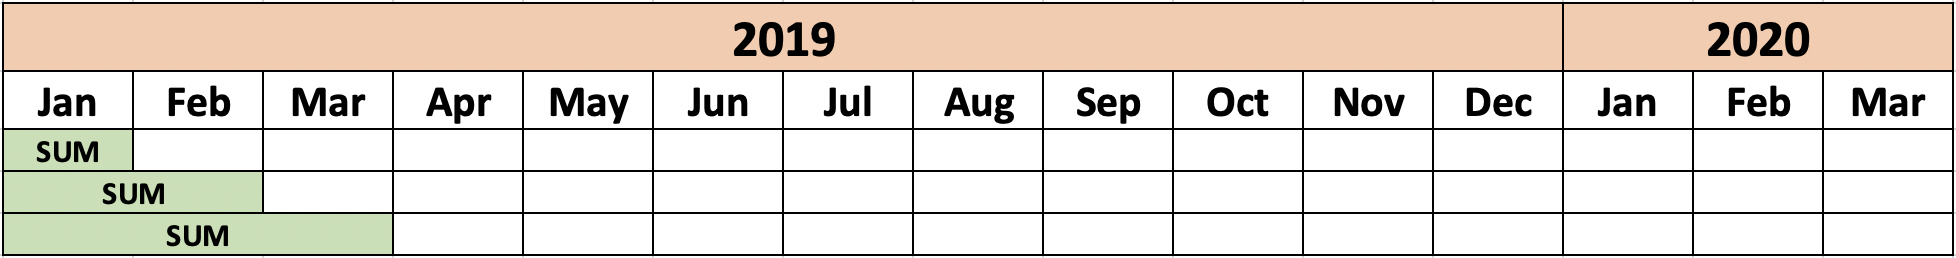
- Monthly figure
- The sum amount of that month
- It can be weekly or daily
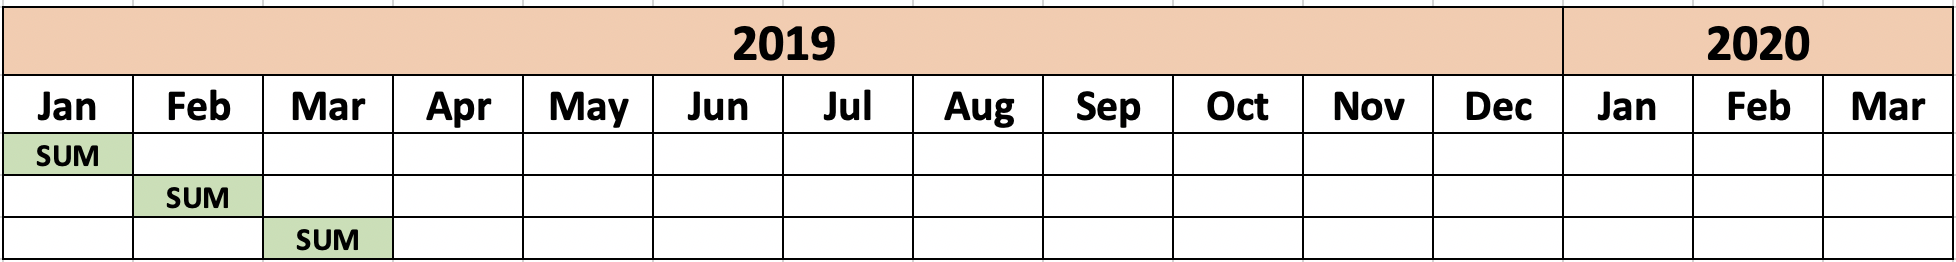
- Cumulative total
- Cumulative total from the first month of this year to current month
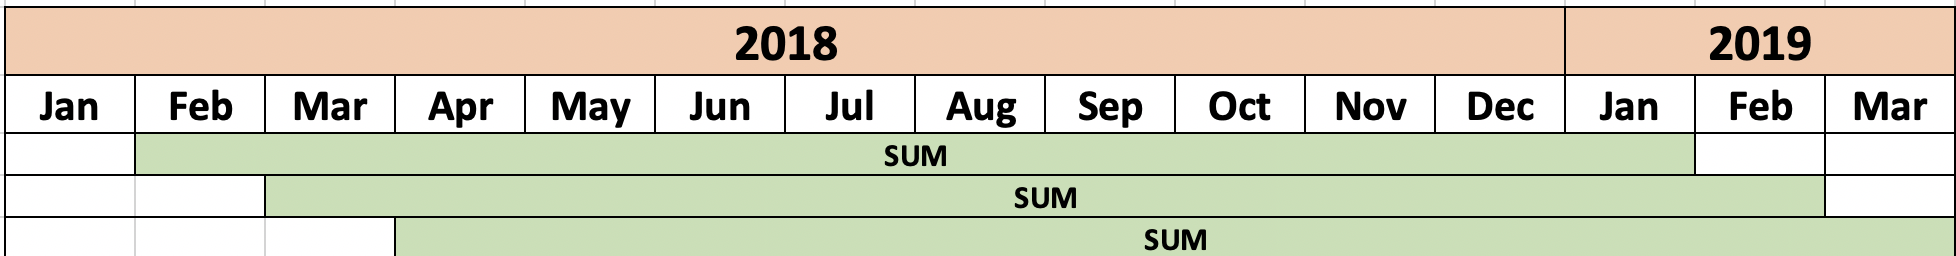
- Moving total
- Total amount from 11 month ago to current
How to analyze Z chart
- Noticeable point on the cumulative total
- The line for the cumulative total figure will be more straight as the monthly figures are regular
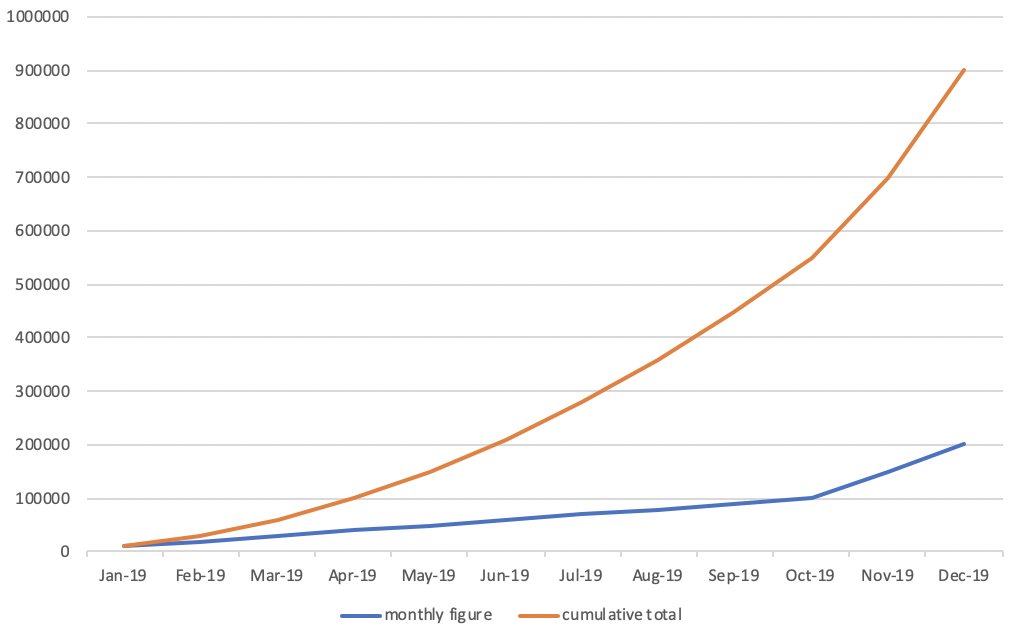
- The lean of the line for the cumulative total figure will become steep as the monthly figures are getting bigger
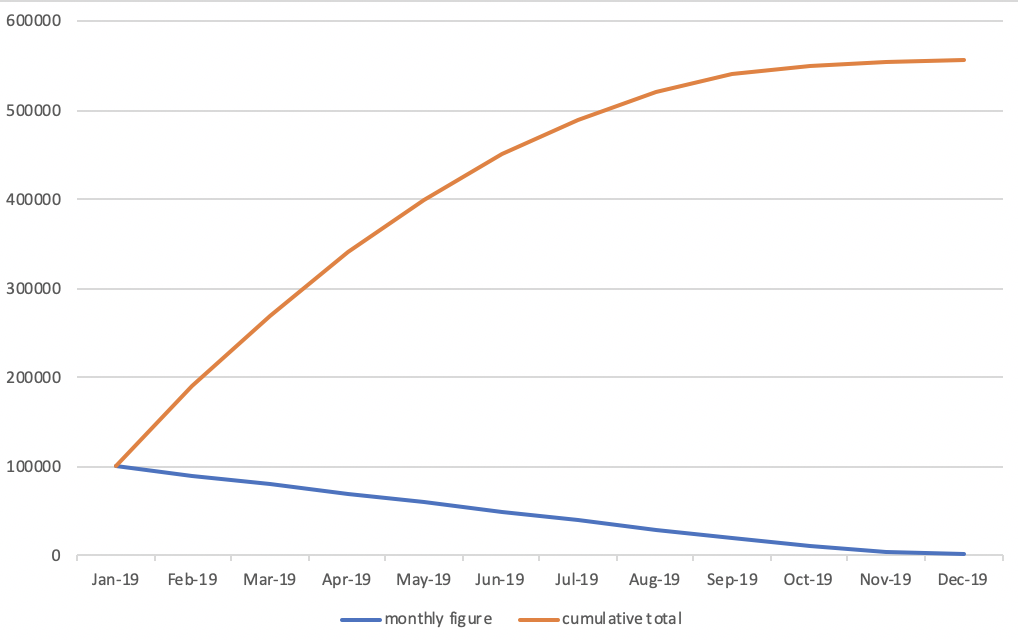
- The lean of the line for the cumulative total figure will be flatting off as the monthly figures are getting smaller
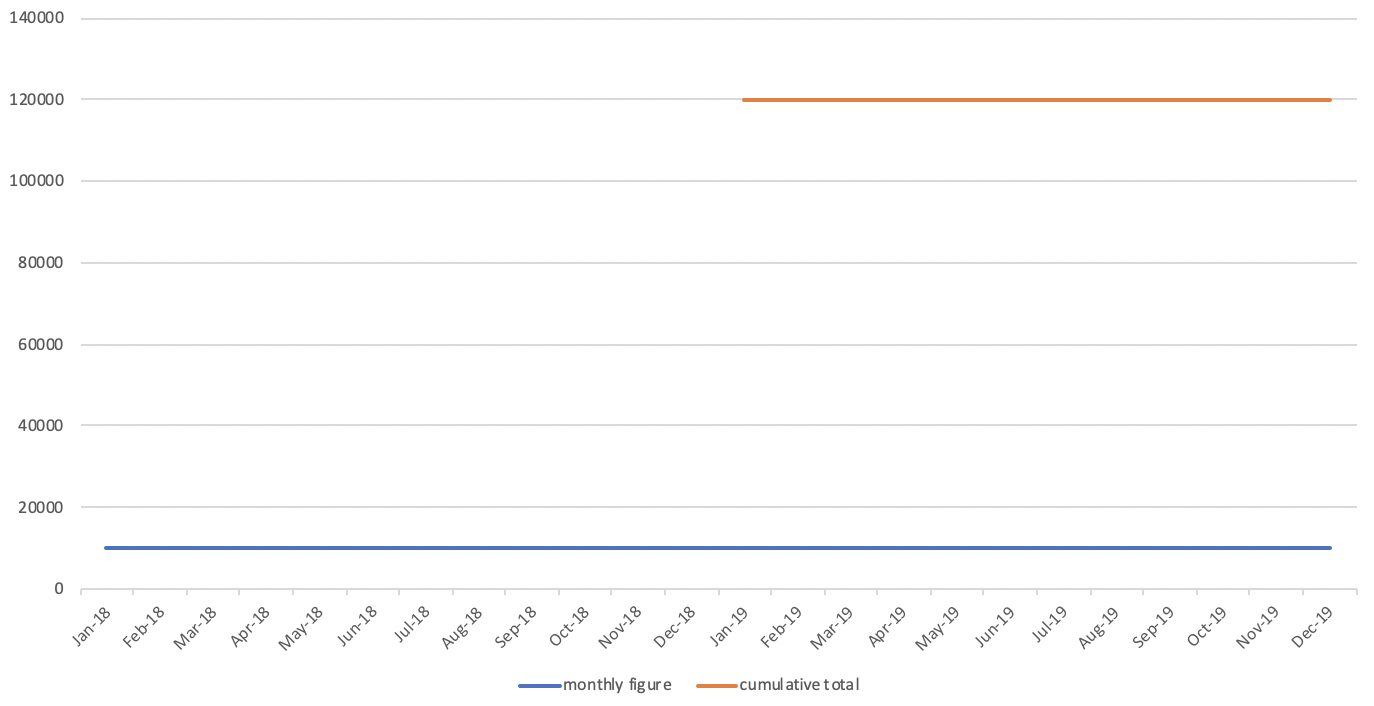
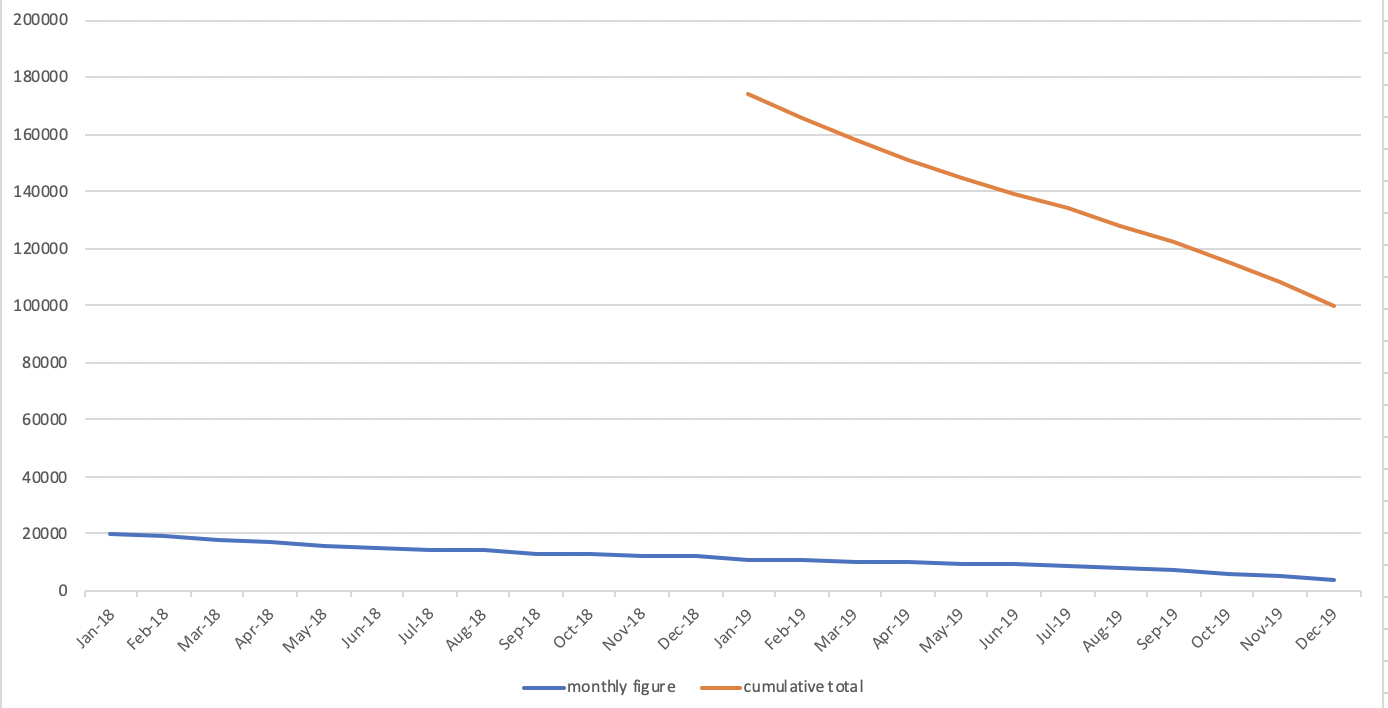
- Noticeable point on the moving total
- The line for the moving total will be straight when the sales amount is regular from last year to this year
- The graph will rise up when there is an increasing trend for sales amount
- The graph will drop when there is a decreasing trend for sales amount
- Various shapes of Z chart
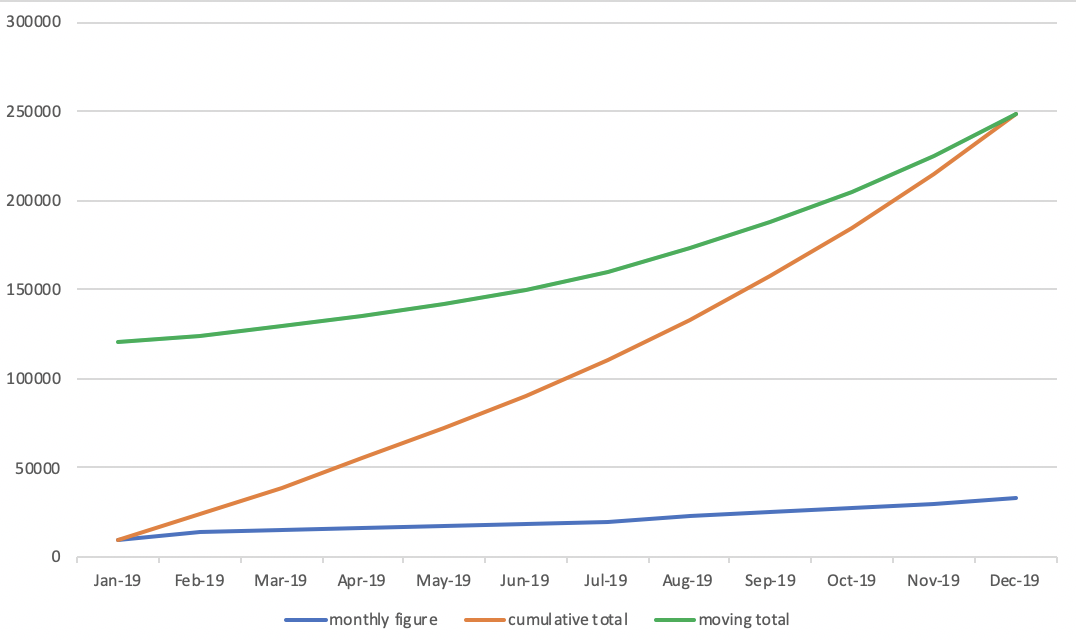
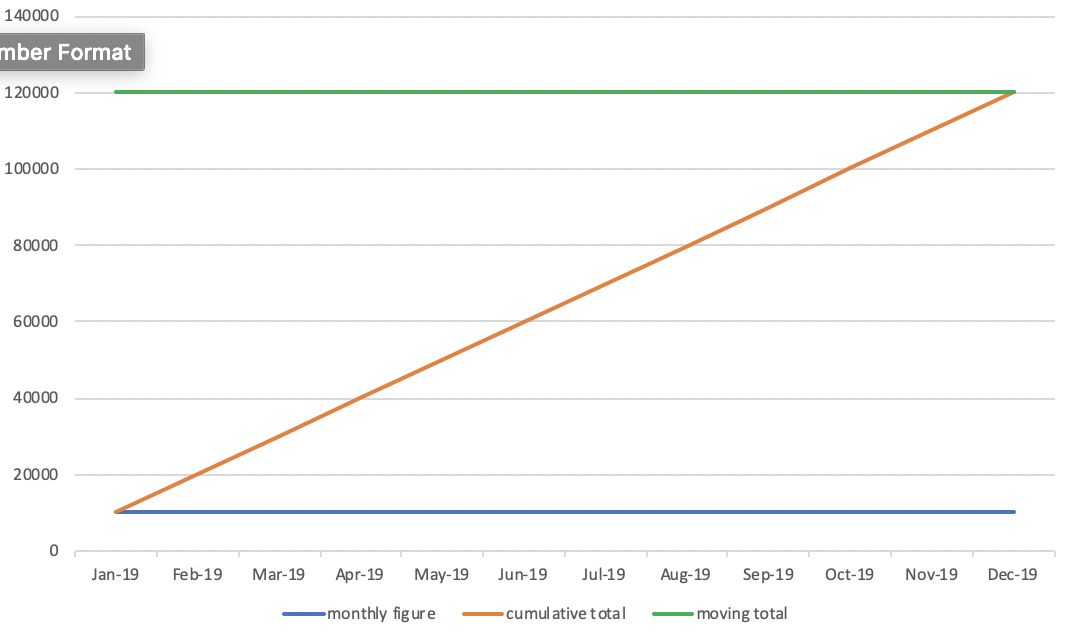
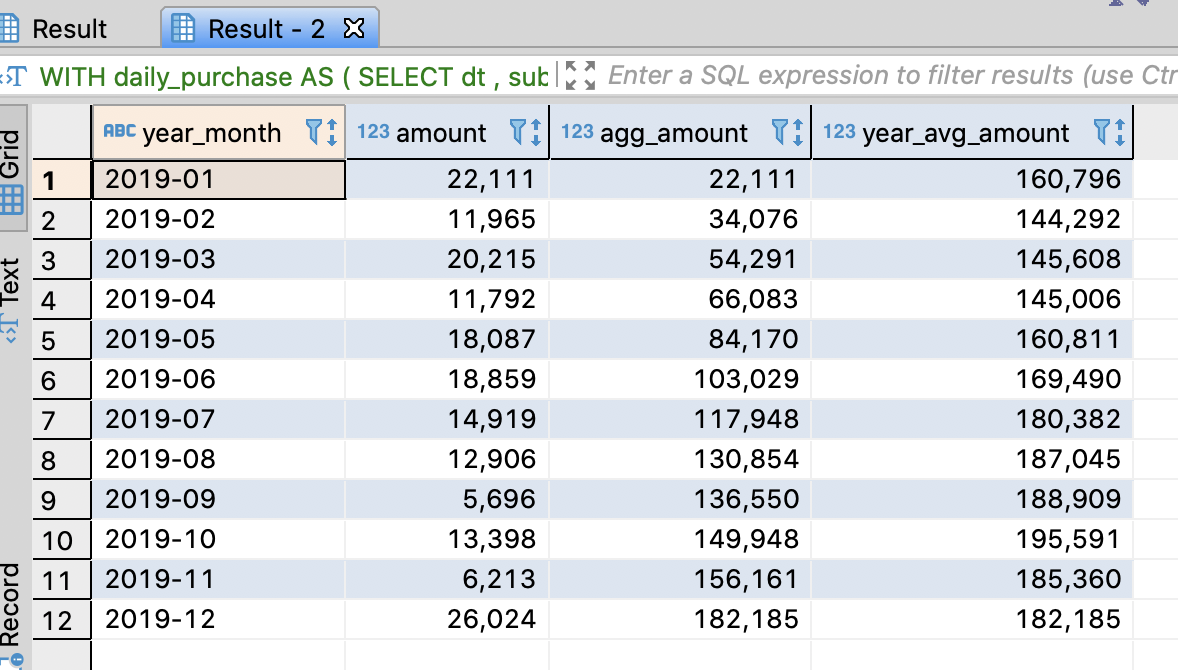
- How to aggregate data for Z chart throug SQL
--- Z chart for sales in 2019
WITH
daily_purchase AS (
  SELECT dt
       -- Extract year, month, date respectively
       -- if PostgreSQL, Hive, SparkSQL, Redshift, use substring
       -- if BigQuery, use substr
       , substring(dt, 1, 4) AS year
       , substring(dt, 6, 2) AS month
       , SUM(purchase_amount) AS purchase_amount
       , COUNT(order_id) AS orders
    FROM purchase_log4
   GROUP BY dt
)
, monthly_purchase AS (
  -- Monthly figure
  SELECT year
       , month
       , SUM(purchase_amount) AS amount
    FROM daily_purchase
   GROUP BY year, month
)
, calc_index AS (
  SELECT year
       , month
       , amount
       -- cumulative total
       , SUM(CASE WHEN year = '2019' THEN amount END)
           OVER(ORDER BY year, month ROWS UNBOUNDED PRECEDING)
           AS agg_amount
       -- Moving total
       , SUM(amount)
           OVER(ORDER BY year, month ROWS BETWEEN 11 PRECEDING AND CURRENT ROW)
           AS year_avg_amount
    FROM monthly_purchase
   ORDER BY year, month
)
-- Select data for 2019
SELECT concat(year, '-', month) AS year_month
     , amount
     , agg_amount
     , year_avg_amount
  FROM calc_index
 WHERE year = '2019'
 ORDER BY year_month
;
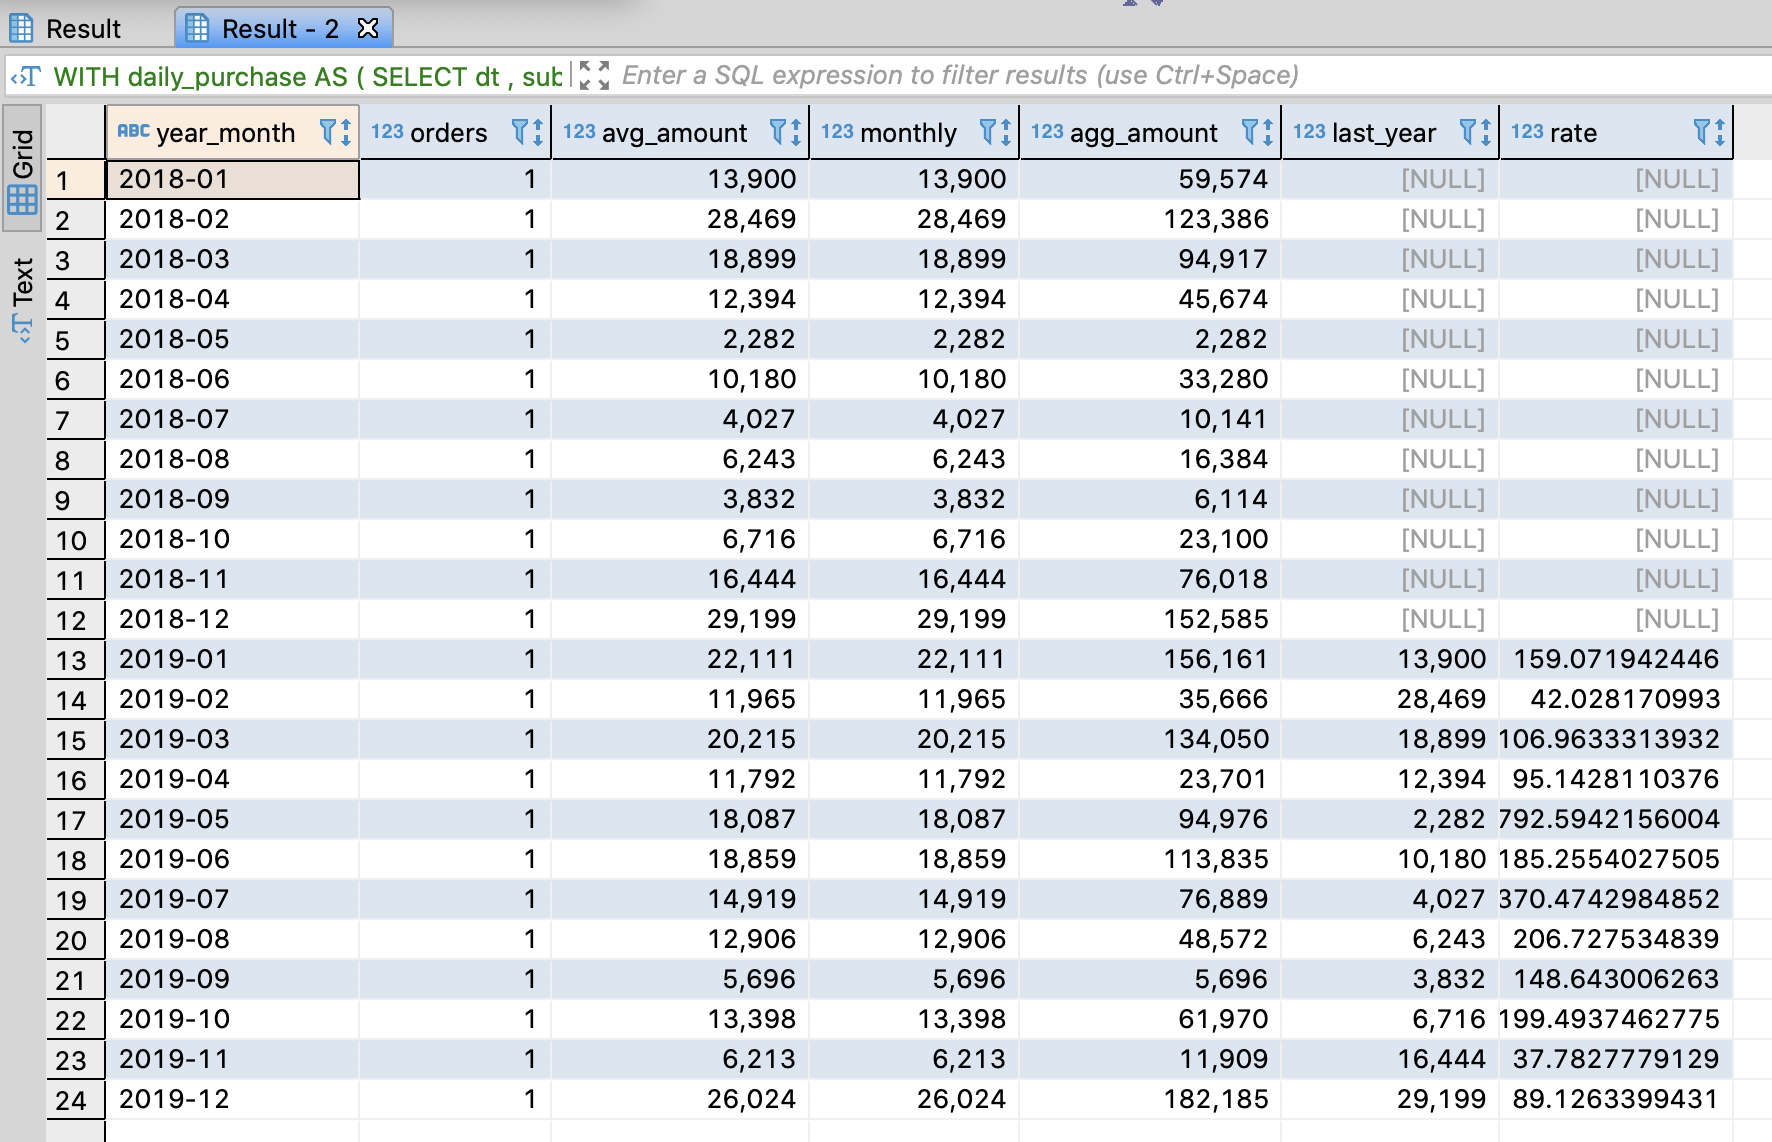
4.9.6. The significant point for analyzing sales
- You have to turn to data about surrounding factors like purchase count, a unit cost to understand the reason why there are changes on sales
-- Aggregate data related with sales
WITH
daily_purchase AS (
  SELECT dt
       -- Extract year, month, date respectively
       -- if PostgreSQL, Hive, SparkSQL, Redshift, use substring
       -- if BigQuery, use substr
       , substring(dt, 1, 4) AS year
       , substring(dt, 6, 2) AS month
       , SUM(purchase_amount) AS purchase_amount
       , COUNT(order_id) AS orders
    FROM purchase_log4
   GROUP BY dt
)
, monthly_purchase AS (
  -- Monthly figure
  SELECT year
       , month
       , SUM(orders) AS orders
       , AVG(purchase_amount) AS avg_amount
       , SUM(purchase_amount) AS monthly
    FROM daily_purchase
   GROUP BY year, month
)
SELECT concat(year, '-', month) AS year_month
     , orders
     , avg_amount
     , monthly
     , SUM(monthly)
         OVER(PARTITION BY year
              ORDER BY monthly
              ROWS UNBOUNDED preceding)
         AS agg_amount
     -- sales amount 12 months ago
     , LAG(monthly, 12)
         OVER(ORDER BY year, month)
         -- if SparkSQL
         -- OVER(ORDER BY year, month
         --      ROWS BETWEEN 12 PRECEDING AND 12 PRECEDING)
         AS last_year
     -- The rate compared to sales amount 12m ago
     , 100.0 * monthly / LAG(monthly, 12)
                           OVER(ORDER BY year, month)
         AS rate
  FROM monthly_purchase
 ORDER BY year_month
;
References
- 데이터 분석을 위한 SQL 레시피 - 한빛미디어
- Z chart - Monash University
댓글남기기