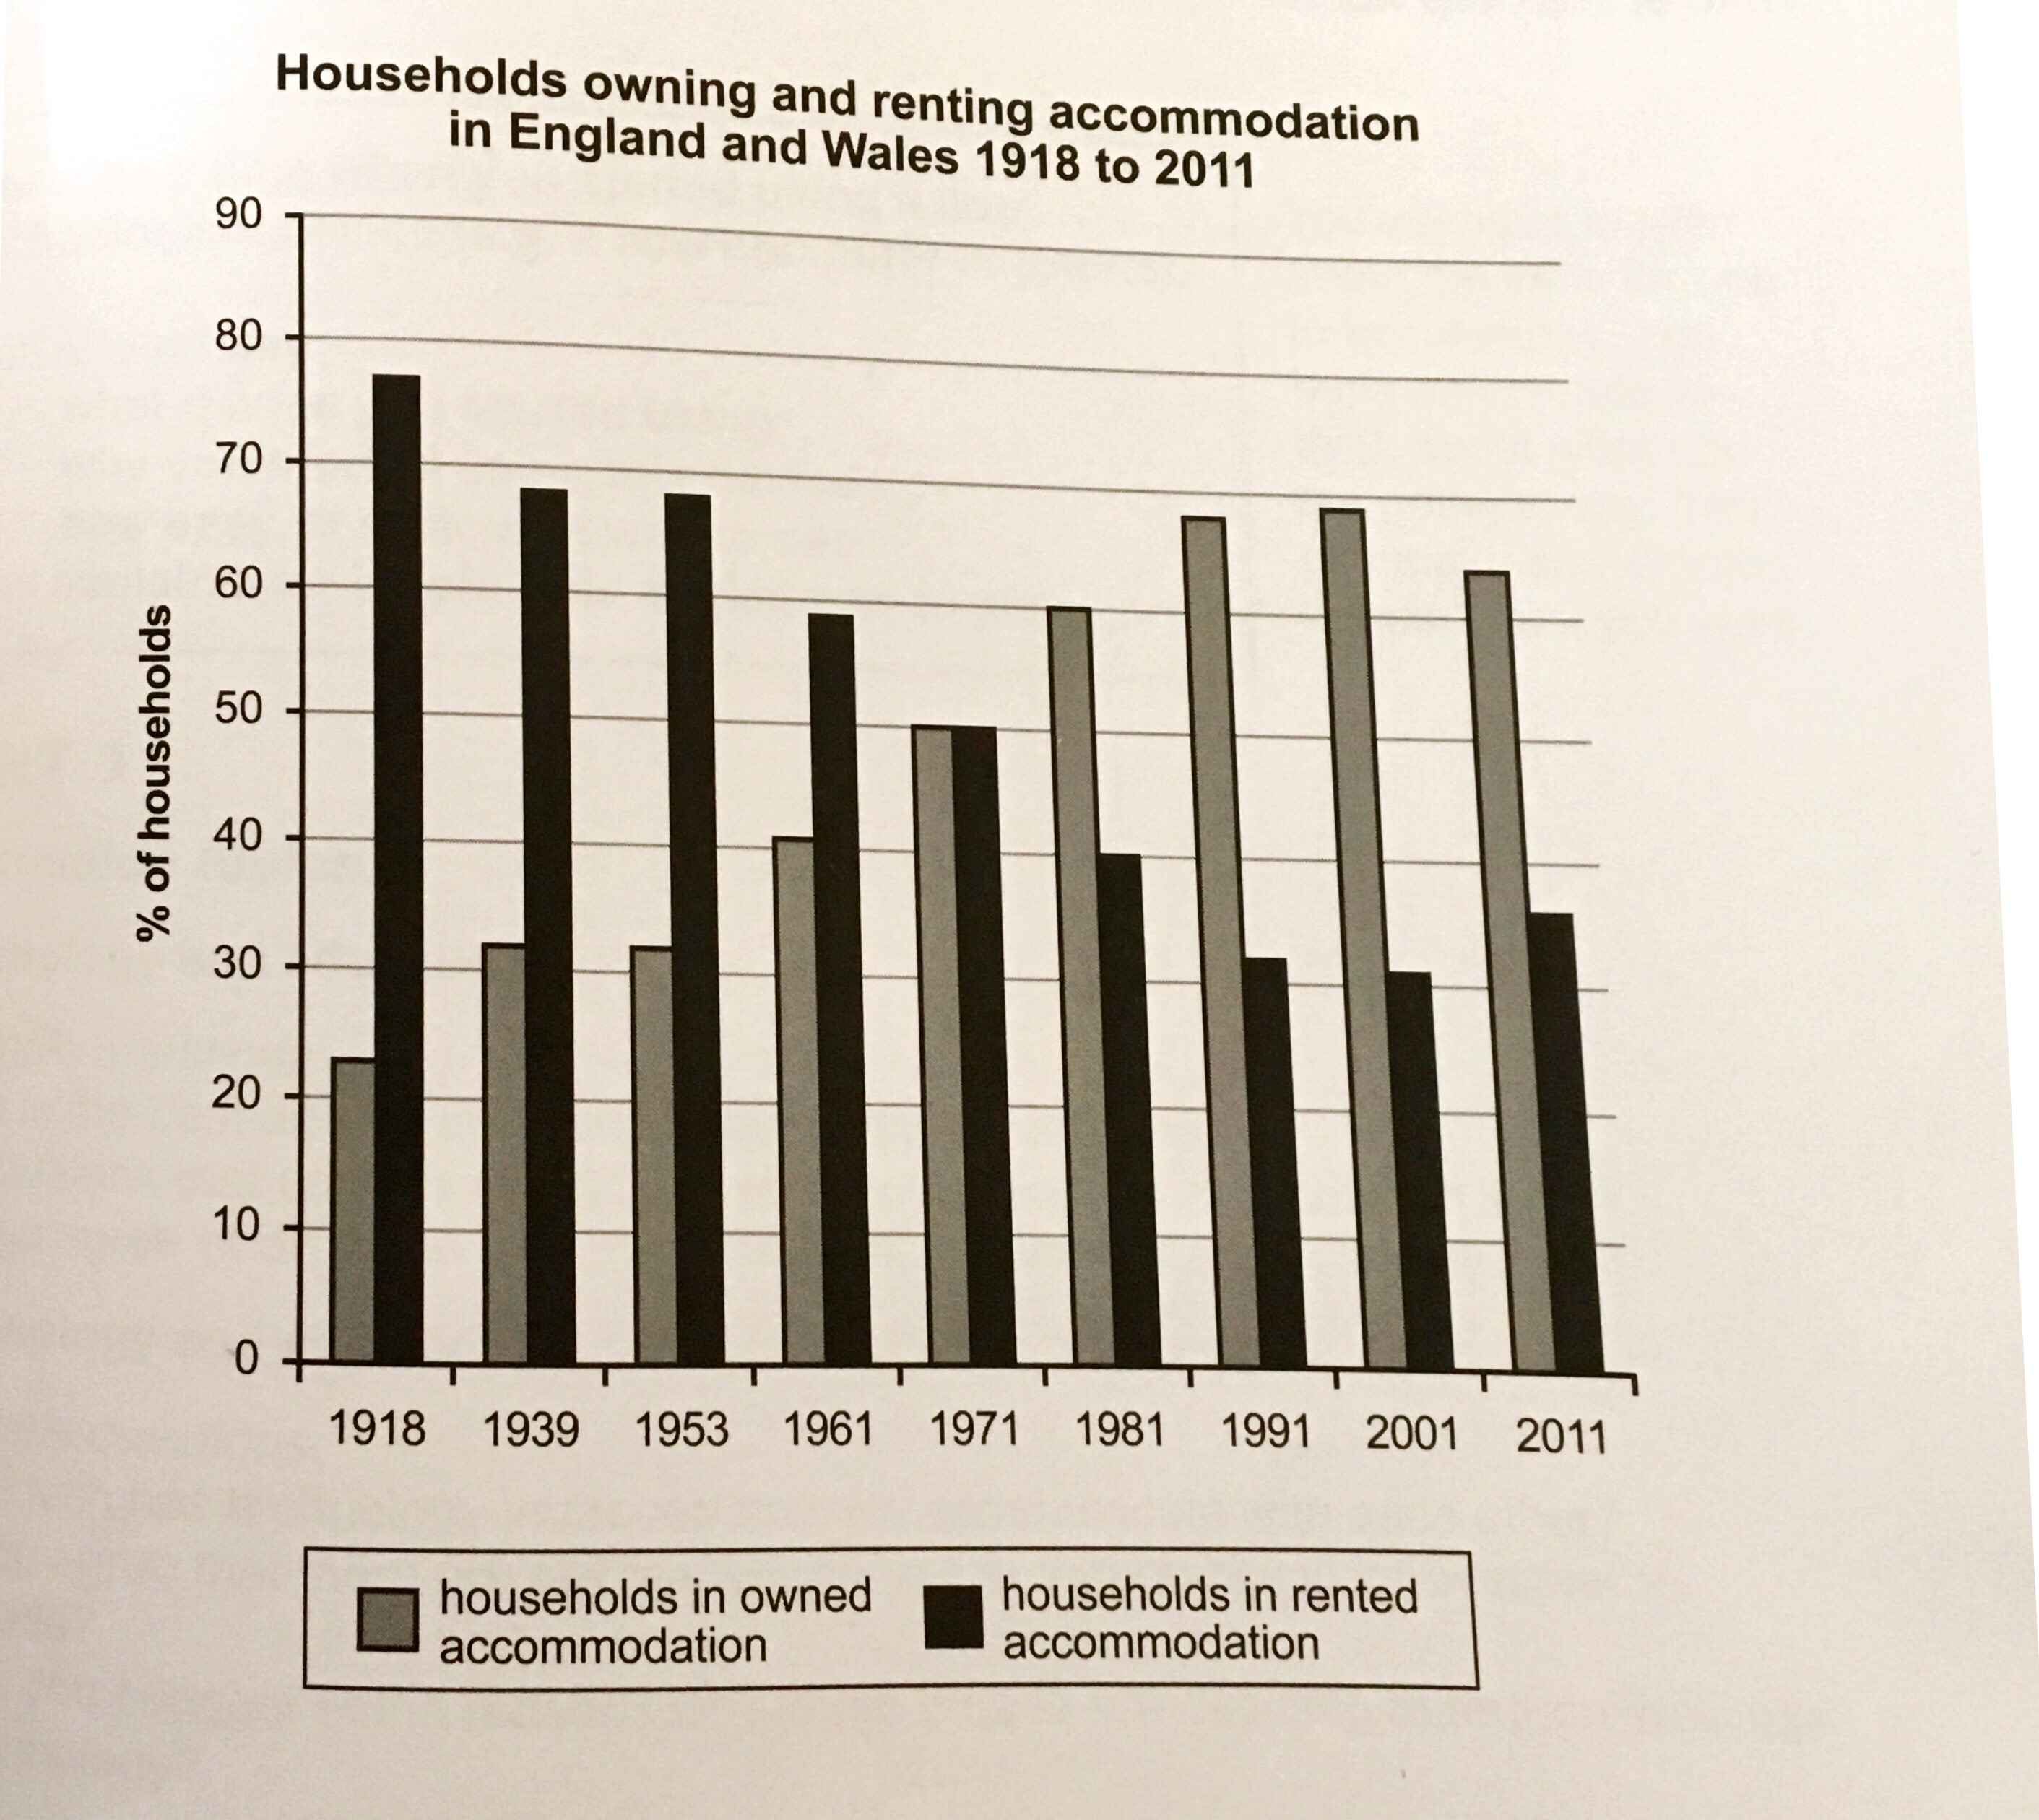
The chart below shows the percentage of households in owned and rented accommdation in England and Wales between 1918 and 2011.
Summarise the information by selecting and reporting the main features, and make comparisons where relevant.
Answer
In my case
Summary
주제
the change in the rate of owned and rented house in England and Wales from 1918 to 2011.
전체 특징
Overall, the percentage of rented one dropped during 80 years.
On the other hand, the percentage of owned one rised.
However, it was reversed in 2011.
세부특징
In 1918, the percentage of households having owned house reached roughly 80%. However, it had been reduced continuesly . Finally, it dropped by abouht 30% in 2011.
The percentage of households in rented was 정반대였다. It was only 20% in 1918. rised up 20-> 70% continuesly.
same in 1971
in 2011, rented reduced little 5%. owned rise 5%
The bar chart shows the change in the rate of owned and rented accommodation in England and Wales from 1918 to 2011.
Overall, it is clear that the percentage of one in a rented house dropped by less 40%. On the other hand, the percent of one in an owned house rose up about 70%. And this trend was reversed in 2011. The gap of them was reduced by 1971. However, it was widened from 1971 to 2001.
Looking at the graph more closely, one can see that the percentage of households having owned house reached roughly 80% and it was tripled of one in a rented house in 1918. However, it had been reduced continuously since then. Finally, it dropped by about 30% in 2011. One in rented accommodations was the opposite. It was only 20% in 1918. Nevertheless, it increased and was the same as one in an owned house. Furthermore, it was doubled in 2001. It rose up from 20 to 70%. Nevertheless, the gap of them was reduced little bit, it was more than 30%.
The bar chart shows the change in the rate of owned and rented accommodation in England and Wales from 1918 to 2011.
Overall, it is clear that the percentage of one in a rented house dropped by less 40%. On the other hand, the percent of one in an owned house rose up about 70%. And this trend was reversed in 2011. The gap of them was reduced by 1971. However, it was gradually broaden from 1971 to 2001.
Looking at the graph more closely, one can see that the percentage of household having owned house reached roughly 80% and it was tripled of one in a rented house in 1918. However, it had been reduced continuously since then. Finally, it dropped by about 30% in 2011. One in rented accommodations was the opposite. It was only 20% in 1918. Nevertheless, it increased and was the same as one in an owned house. Furthermore, it was doubled in 2001. It rose up from 20 to 70%. Nevertheless, the gap of them was reduced little bit, it was more than 30%.
댓글남기기